Tags
How to know how much the app is consuming from memory? Where is the application bottleneck? How are the application Threads? How many classes are being loaded? How many instances are being created?
You can answer these questions by monitoring the JVM and using Profiling (this is the process of monitoring parameters at the JVM level, such as Method Execution, Thread Execution, Object Creation, and Garbage Collection).
In the post about testing tools (Let’s try something different: Testing Tools 01) it was possible to measure if the application tolerates X accesses, the response time of the application and etc. Now let’s measure HOW the JVM is reacting to this.
For this example, we will use VisualVM because it is free, easy to use and has a good amount of information, and we will also use the java-sample-project project. The use of VisualVM is very simple: when downloaded, you unzip it and execute the visualvm file inside bin folder. Follow the guidelines in the Java Sample Project to run the project. When VisualVM and the project are started, VisualVM should look like this:
- To expand the JavaSampleProject.jar data, simply double-click it. Something like this should appear:
A little about the tabs:
- Monitor – Displays CPU, memory, thread and class data in charts.
- Threads – Shows the current threads along with Thread state and running time.
- Sampler – Takes a dump of the running threads to do the real-time analysis.
- Profiler – It instruments all methods of the code to do the analysis in real time.
For this overview, let’s use the Sampler tab. In this tab you will have two options: CPU and Memory. Let’s use Memory. For this example, we will filter just the classes from the com.conscious package of the JavaSampleProject. So it must be like this:
- Note that the informations are: the name of the classes, the number of bytes used and the number of instances. Note that on top of Instances you have two options: Perform GC and Heap Dump. Let’s use the Heap Dump.
- After using the Heap Dump, the Heap information will be saved at exactly that moment.
- Now, let’s go to http://localhost:8081/ in the Browser and create any User.
- After creating a User, come back at Sampler tab. Note that you now see an object of type User:
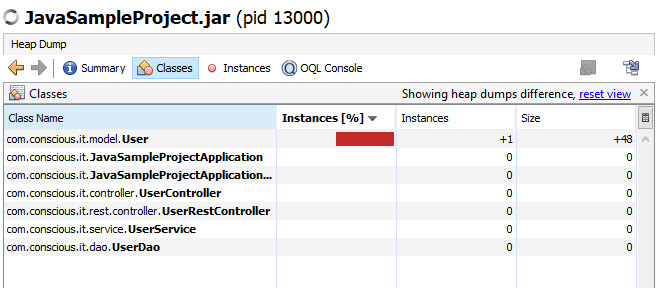
- Take another Heap Dump. When entering the heap dump screen, click Classes > Compare with another heap dump and use the previous dump to compare and filter by com.conscious
- It should look like this.
Now that you have a sense of how to view objects, monitor the JVM, and everything, try using some of the load / performance testing tools in the application and see how the JVM reacts. That is it, I hope you enjoyed it.


Pingback: Tracks – You might have lost 01 | Conscious IT